


Using SWAT MAPS in Potato Production
Monday, October 4, 2021 12:00 PM
Reading Time: 5 minutes
SWAT MAPS originated in Western Canada and have mainly been applied in cropping systems involving canola, wheat, barley, lentils, and other similar field crops. Here in Prince Edward Island, our agricultural landscape is dominated by potato production. Rather than looking to Western Canada for solutions, we often turned to Western Europe and places like Belgium and Holland. They have small fields, and similar to P.E.I., are also known for growing a lot of potatoes. During a study tour there in the Fall of 2018 we visited the farm of Jacob van den Borne, a Dutch potato farmer known for his success in using technology to improve production. Jacob was a big advocate for soil scanning with electrical conductivity (EC) sensors to identify differences in your “soil battery” – finding out which parts of your field had the ability to hold a bigger charge (in terms of retaining moisture and nutrients) than others. He used this information on his farm to inform fertilizer applications and variable rate (VR) seeding. His average field size was less than 10 acres, but he was still managing the soil variability within the field and having success. There is one significant difference, though, between the area where Jacob farmed and Prince Edward Island – topography. I understood the influence that topography was having in our fields as it related to production, and when I found out that SWAT MAPS used both EC data and topography, I knew we had a solution to move forward with.
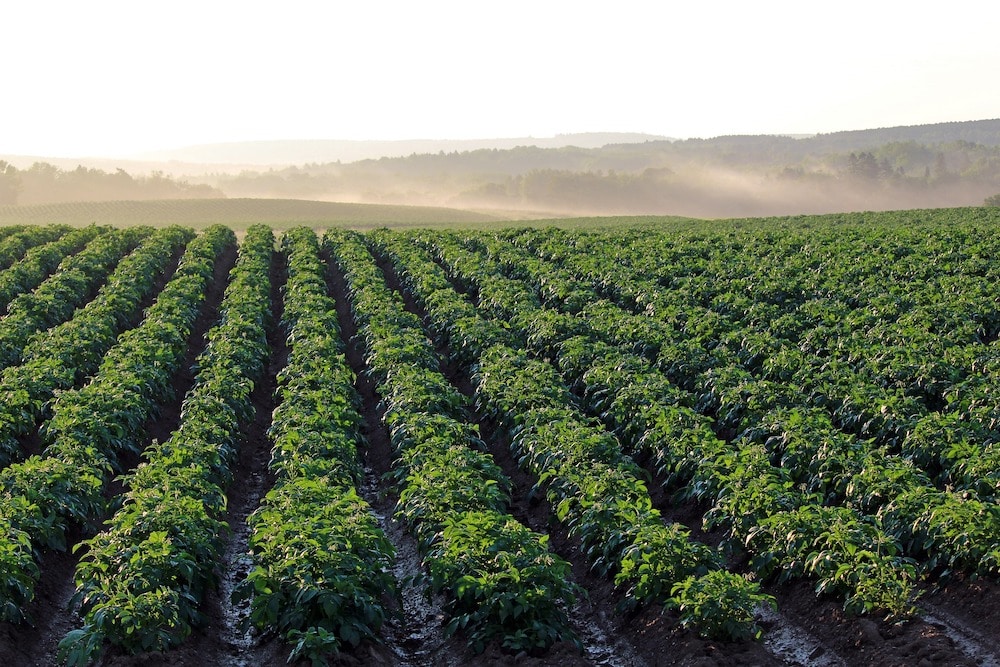
Understanding differences in how water moves across a field, where it collects, where it sheds and where erosion has occurred, as well as where your soil battery is larger or smaller, can have value in any agricultural production system anywhere in the world. Potatoes are a crop that rely heavily on water. Eugenia Banks, a Potato Specialist with the Ontario Potato Board, notes that “Potato tubers contain no less than 80 per cent water” and refers to water as “the single most limiting factor in potato production” (Geddes, 2017). Particularly in rain-fed potato production systems, there can be significant differences in yield potential across a field throughout SWAT Zones.
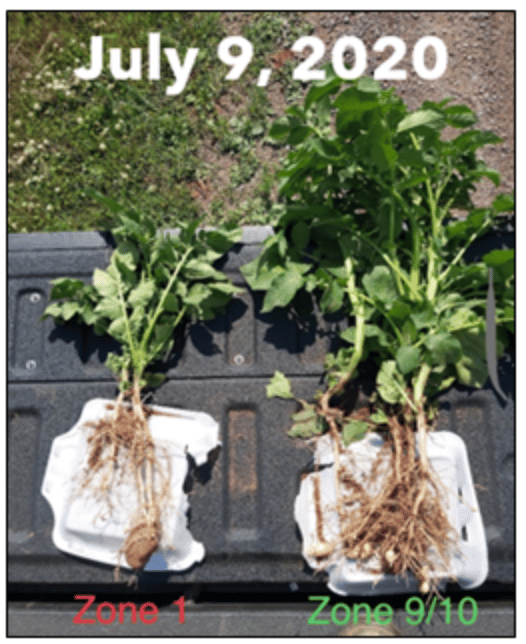
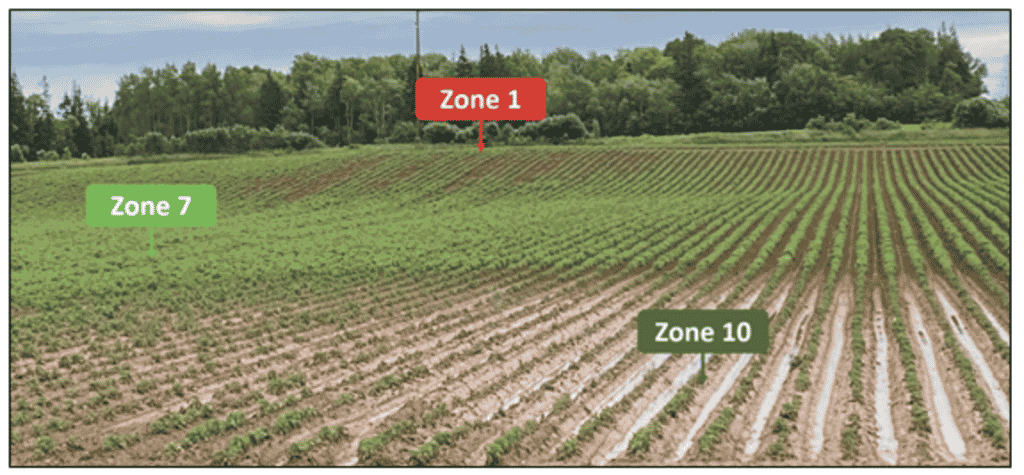
The image above shows differences in tuber initiation and canopy development between a Zone 1 and Zone 10. Samples were taken 100ft from one another in the same row. Zone 1 hilltop areas are often the driest parts of the field, and sometimes have shallow topsoil depth due to wind, water and tillage erosion. These zones are typically lower yield potential areas of the field. Zone 10 depression areas are often the places in the field with the most moisture – and this may result in row drainage issues in wet or even average years, or at certain times of year when rainfall is more common, such as harvest.
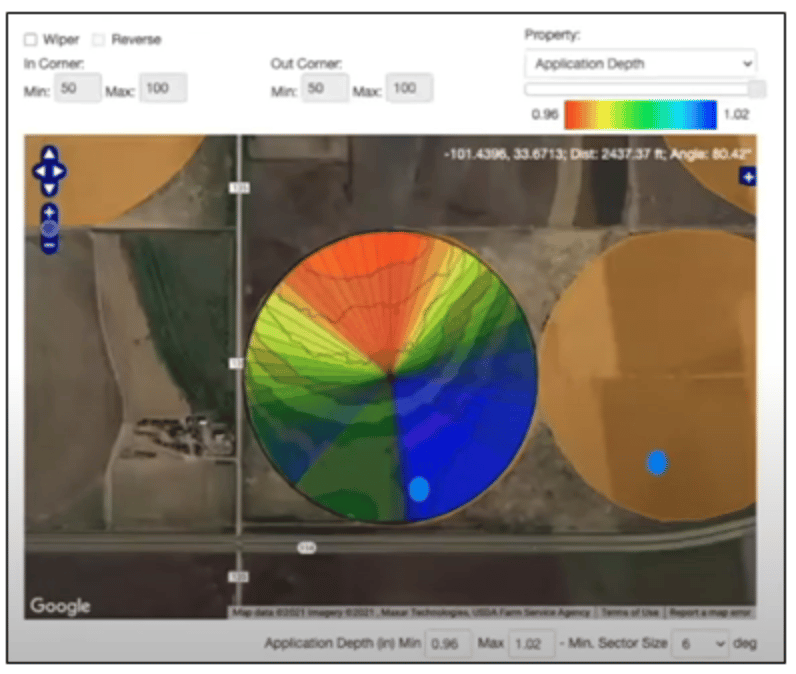
In irrigated production systems, SWAT WATER can help to inform variable rate irrigation decisions. We know that soil moisture varies across the landscape and applying a uniform amount of water over an entire field may result in over application in some areas, and under application in others. SWAT WATER combines the understanding of soil and landscape variability (which drives soil moisture variability) with real time weather and plant available data from weather stations and soil moisture probes.
So, understanding that SWAT MAPS do a good job of identifying differences in soil potential - what can we do with them?
VR fertilizer and soil amendment applications:
Fertilizer uptake is highly driven by moisture availability. A study focused on Precision Agriculture in Potato Production by Agriculture and Agri Food Canada in 2014 looked at comparing high density grid sampling (15m x 15m) vs a management zone (MZ) approach based on detailed soil data. The researchers focused on Phosphorous and Potassium applications and found that the MZ approach was more effective in terms of both productivity and profitability, while reducing environmental impacts (Cambouris et al., 2014). Many areas of agricultural production rely on grid sampling information for VR fertilizer decisions, and although grid sampling gives an indication of specific nutrient levels, it does not account for differences in soil potential, which often determine yield at the end of the season. The SWAT MAPS process includes collecting physical soil samples, and is often used for VR N,P,K, Lime and more.
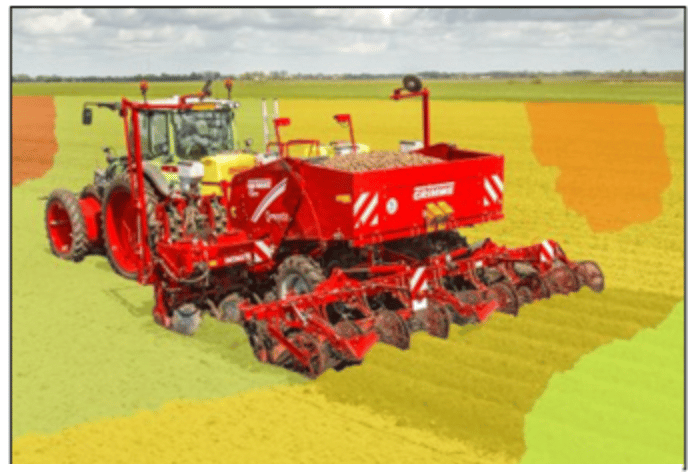
VR seeding:
Various studies (Reckleben et. Al 2017; & Munnaf et. Al 2021) have shown that VR seeding of potatoes can increase profitability by up to $250 CAD/ac by optimizing seed distribution according to management zones within the field. As an example, Zone 1 hilltops which are typically low yield potential zones and may have smaller tubers at harvest could have seed spaced further apart, to lower costs and reduce stress per plant. Most new potato planters can do VR seeding automatically with shapefiles loaded on the controller.
VR irrigation:
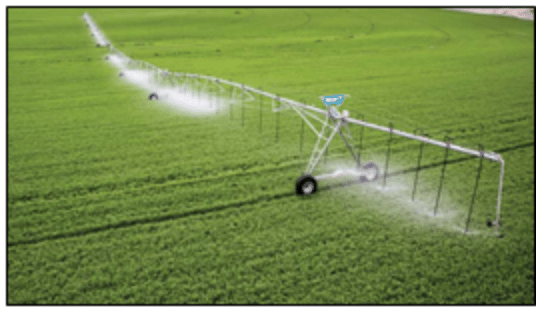
As mentioned above, SWAT MAPS and SWAT WATER can account for spatial differences in soil moisture across the field and be used for VR irrigation prescriptions to control pivot speed, or specific nozzles/zones along the pivot.
Other Applications:
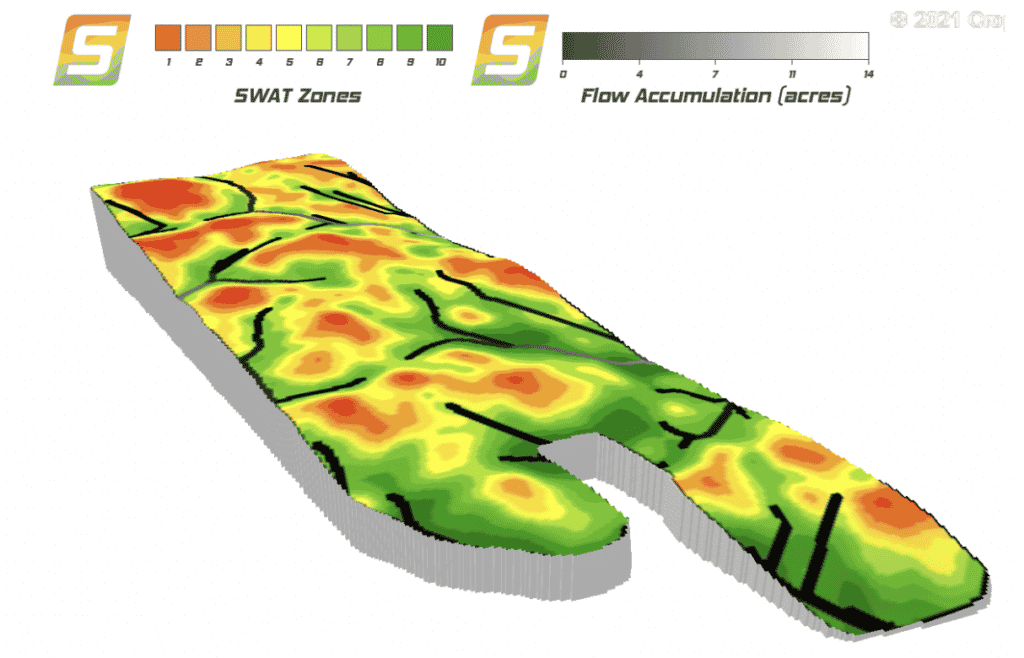
In addition to variable rate application of inputs, SWAT MAPS can be used for water management including drain tile placement and identifying ideal locations for grassed waterways. Figure 6 below shows a SWAT MAP in 3D overlaid with flow paths. Each flow path is symbolized based on how many acres of the field drain through it (as indicated in the legend). Paths with a significant area draining through them may be better off as grassed waterways, especially if there are erosion issues in the field.
Learn more by watching the video below:
Evan MacDonald
Precision Agronomist
evan@swatmaps.com
References
Cambouris, A. N., Zebarth, B. J., Ziadi, N., & Perron, I. (2014). Precision Agriculture in Potato Production. Potato Research, 57(3–4), 249–262. https://doi.org/10.1007/s11540-014-9266-0
Geddes, G. (2017, April 12). Potatoes and Water Management: From Deluge to Drought. Spud Smart. https://spudsmart.com/potatoes-water-management-deluge-drought/
Munnaf, M. A., Haesaert, G., van Meirvenne, M., & Mouazen, A. M. (2021). Multi-sensors data fusion approach for site-specific seeding of consumption and seed potato production. Precision
Agriculture. Published. https://doi.org/10.1007/s11119-021-09817-8 Reckleben, Y., Grau, T., Schulz, S., & Trumpf, H. (2017). Effects of precision potato planting using GPS-based cultivation. Advances in Animal Biosciences, 8(2), 450–454. https://doi.org/10.1017/s2040470017000036
Become a SWAT News insider!
Sign Me Up!
Join Our Mailing List
Enter your email below to sign up for our mailing list.
We care about the protection of your data. We’ll never share your details.
Croptimistic Technology Inc. is an international agriculture technology (AgTech) company. We began operating in 2018. Croptimistic is supported by a growing team of professionals who have dedicated their careers to developing the best soil mapping software and hardware in the world.
Copyright Croptimistic Technology Inc. © 2024 All Rights Reserved.
Privacy Policy