


Corn, soybeans, and the ultimate SWAT VR planting strategy
Wednesday, July 5, 2023 1:21 PM
Reading Time: 3 minutes
Proper seeding or planting rates can set the standard for a whole growing season. The objectives of SWAT MAPS variable rate fertilizer applications are straightforward: match fertilizer rates with soil and water potential according to landscape position and zones.
Variable rate seeding or planting strategies are a little more complicated however, but the same principles of varying rates according to zone can be applied. Not only can seeding or planting rates match soil and water potential but taking it one step further, using plant physiology to achieve goals like more even maturity, reducing disease, or pushing yield.
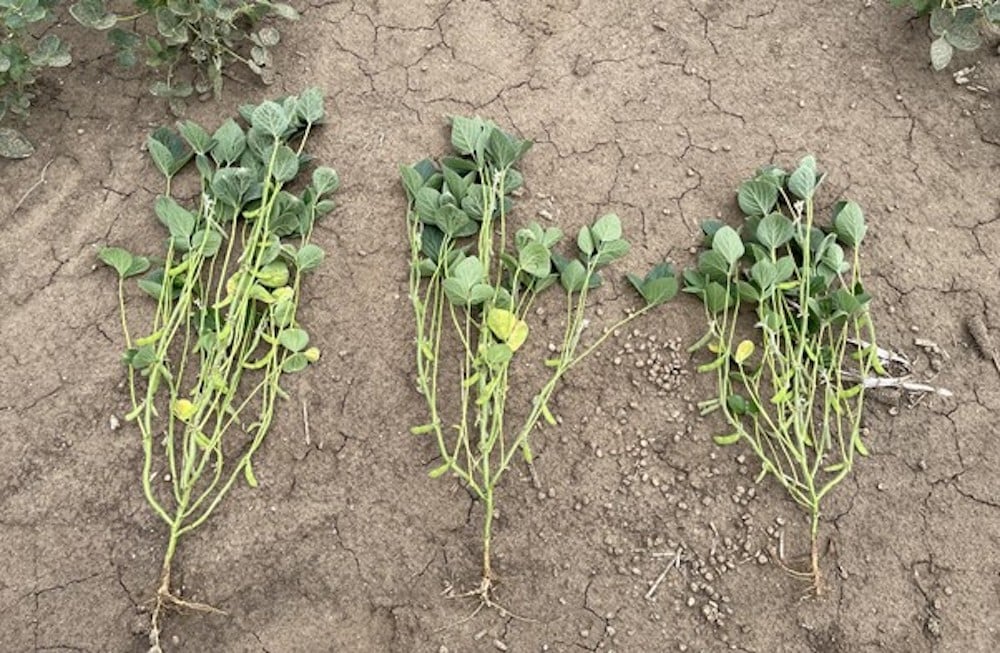
For Trent Mastny, co-owner of JTM Ag, SWAT MAPS service provider, and farmer at Howells, Nebraska, soybean planting rate may have a lot to do with the number of desired nodes per plant.
“I noticed that there were different nodes per zone,” said Mastny during a recent conference held by SWAT MAPS. When you’re looking at a soybean plant, nodes per plant has a big impact on soybean yield. So what we really wanted to get out of this was: how can I even up my nodes per zone to create a more even yield for that field?”
Mastny and his team took a closer look at nodes per plant in each of their SWAT zones. Their normal target plant population is 120,000 plants per acre. In zone 1, they found an average of 17 nodes per plant; zone 4 had 18 nodes per plant; and zone 8 had 20 nodes per plant.
Creating a SWAT MAPS VR seeding prescription for soybeans starts with determining what the goals are: evening out the number of nodes per zone is a start; disease pressure and lodging issues in SWAT zones 8 through 10 are a concern so seeding rate is decreased somewhat to improve airflow.
In SWAT zones 1 through 5, more nodes per plant are needed, and more plants per zone, and in zone 8 through 10, the concern is disease pressure and lodging issues, so thicker stalks and more airflow are the goals. Mastny says that zones 7 through 10 were green for much longer than zones 1 through 4, which were ready to harvest a week earlier.
Mastny proposes using a node factor to determine how much the seeding rate should differ from the average target plant population (see below).
| Zone | Average Population Goal (seeds/acre) | Node Factor | Final Population (seeds/acre) |
| 1 | 120, 000 | 1.1 | 133, 000 |
| 4 | 120, 000 | 1 | 120, 000 |
| 8 | 120, 000 | 0.9 | 108, 000 |
| Field Average | 120, 000 | ||
“If I’ve got 120,000 plants per acre in that area and I’ve got 17 nodes, but if you got to a different zone and I’ve got 18.5 nodes per plant, what’s that difference? 18.5 divided by 17 is 1.1, so I need to increase our seeding rate by 1.1,” says Mastny.
By pushing seeding rates higher, soybean plants will compete with each other and grow more upright, putting on more nodes per plant, which means supporting more pods per plant in each zone.
Mastny and his team also gathered some information on corn populations.
The goal for corn seeding rates is heavily dependent on water availability; increasing plant population where there’s more water available and decreasing plant population where there’s less water available. Hybrid selection also plays into planting rate and choosing a flex or semi-flex ear hybrid if seeding rates are decreased in order to still capture yield potential if seeding rates are decreased.
Mastny variable rate planted a 50-acre field based on different zones and different plant populations: zones 1 through 3 at a rate of 26,000 plants per acre; zones 4 through 6 at 28,000; and zones 7 through 10 at 31,000. There was also a check strip planted across the whole field, in all ten zones at a rate of 29,000 plants per acre.
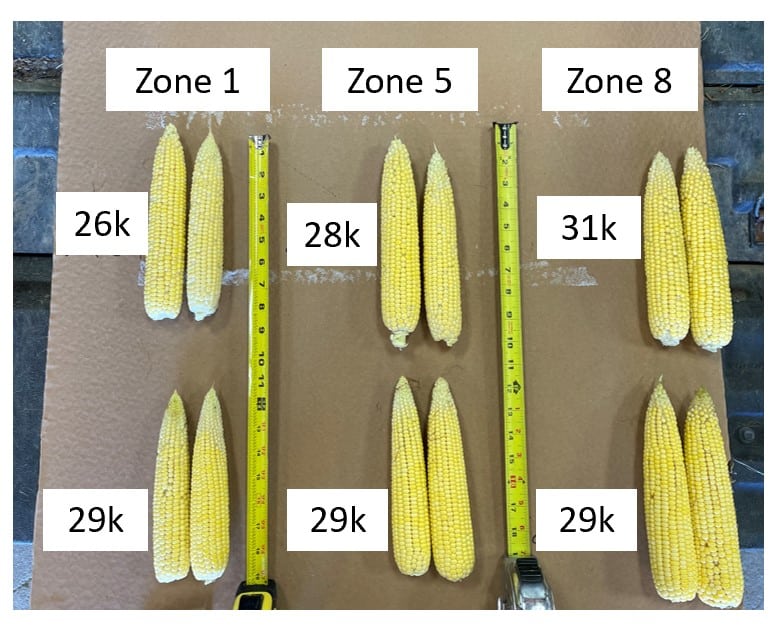
There was a considerable amount of tipback in zone 1 between the 26,000 plants per acre and 29,000 plants per acre plots says Mastny, and not much difference between plant populations in the zone 4 or zone 8 plots.
To take it one step further, Mastny applied some economics to the case study.
| Population | Yield by Zone | Yield Difference | ROI ($6.00/bu) | |
| Zone 1 (VR) | 26,000 | 135 | +28 bu/ac | + $78/ac |
| Zone 1 (FR) | 29,000 | 107 | ||
| Zone 4 (VR) | 28,000 | 142 | -1 bu/ac | |
| Zone 4 (FR) | 29,000 | 143 | ||
| Zone 8 (VR) | 31,000 | 159 | +7 bu/ac | |
| Zone 8 (FR) | 29,000 | 152 | ||
| +13 bu/ac | ||||
Variable rate seeding or planting strategies will differ from crop to crop, field to field, and region to region. SWAT MAPS allows compensation for variable mortality in different soil types to match established populations to soil and water potential by zone across a field. The end goals may include more even maturity, reduce disease risk or lodging, improve harvest efficiency, reduce seed costs, and to increase yield. Good data combined with boots on the ground shows that variable rate planting with SWAT MAPS offers real value.
Lara de Moissac
Precision Agronomist
Presented by Trent Mastny

Become a SWAT News insider!
Sign Me Up!
Join Our Mailing List
Enter your email below to sign up for our mailing list.
We care about the protection of your data. We’ll never share your details.
Croptimistic Technology Inc. is an international agriculture technology (AgTech) company. We began operating in 2018. Croptimistic is supported by a growing team of professionals who have dedicated their careers to developing the best soil mapping software and hardware in the world.
Copyright Croptimistic Technology Inc. © 2024 All Rights Reserved.
Privacy Policy